Simon User Guide
Monitor Checks

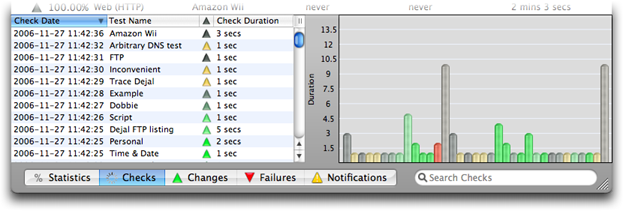
This area of the main window contains a table listing the recent checks of the tests. As with the statistics, if no tests are selected, the checks of all tests are listed; if some or one are selected, only the checks from those selected tests are listed. The columns can be sorted, and the order toggled, as desired. This table is mainly interesting to see recent check durations for all tests, or just a few or one.
Also included is a chart that graphically depicts the recent checks. The chart automatically updates as checks occur. The colors of the bars correspond to the statuses of the tests. The most recent checks are on the left of the chart. The chart or table can be hidden or resized by dragging the splitter bar between them. Double-clicking the splitter will quickly hide the chart.
There is also a search field. This is useful to refine the information shown in the table and chart even further. You can select one or more tests in the tests table, then enter some text in the search field to view just the table lines that contain that text.
Here are the details of the columns:
Check Date: This column displays the date and time that the check occurred.
Test Name: This column displays the name of the test that this relates to; useful when displaying checks for multiple tests.
Status: This column displays the status of the test, resulting from this check.
Check Duration: This column displays how long the check took to complete.
Return to the Monitor window page
Go to the User Guide Contents
Return to the main Simon page

